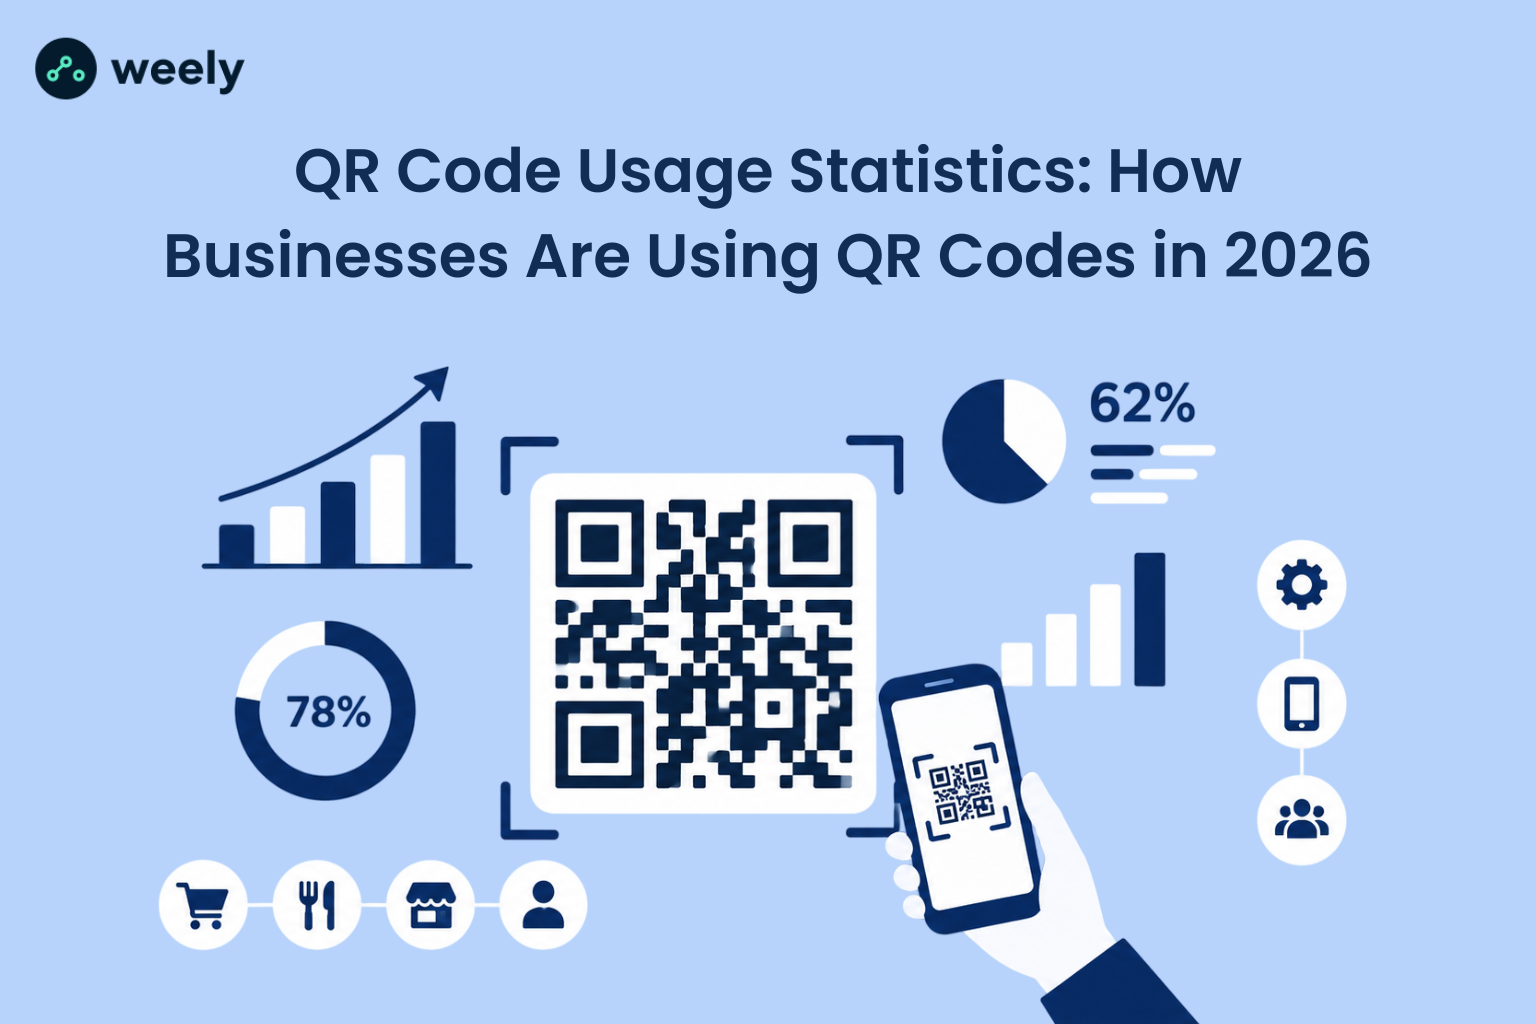
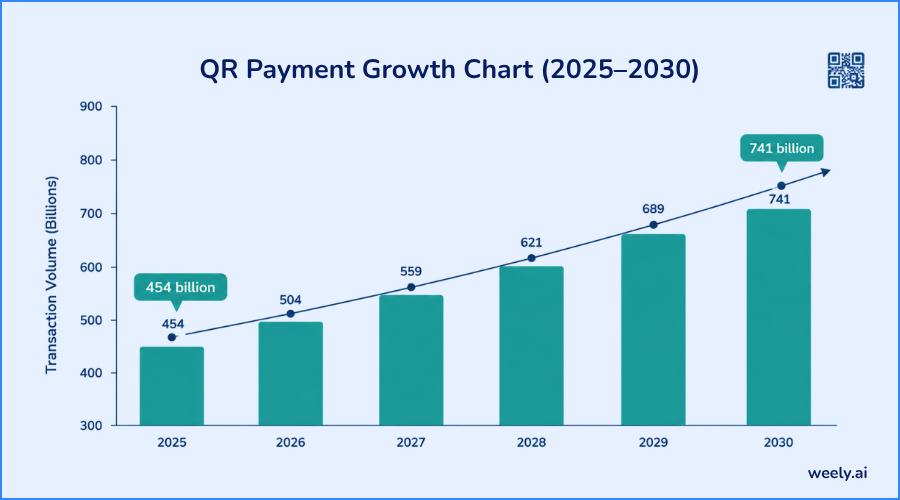
QR codes started as a pandemic-era shortcut for touchless menus, and check-ins. They have become permanent business infrastructure in 2026. The latest QR code usage statistics 2026 show that 98% of marketers report a positive impact from QR codes, 76% now use dynamic QR codes instead of static ones, and scan volume grew 6.2% year-over-year, according to the latest industry scan data. On the payments side, QR-based retail transactions are forecast to jump from 454 billion in 2025 to 741 billion by 2030.
The bigger story behind these numbers is a shift in mindset. Businesses once measured success by the number of QR codes they printed. Now they track scans, click-through rates, conversions and revenue tied to each code. This article covers QR code usage statistics 2026 by consumer behavior, business adoption, payments, marketing, packaging, restaurants, security and where the technology is headed next.
QR Code Statistics 2026: Key Numbers at a Glance
Before going deeper, here are the core QR code usage statistics 2026 that set the stage for everything else in this article:
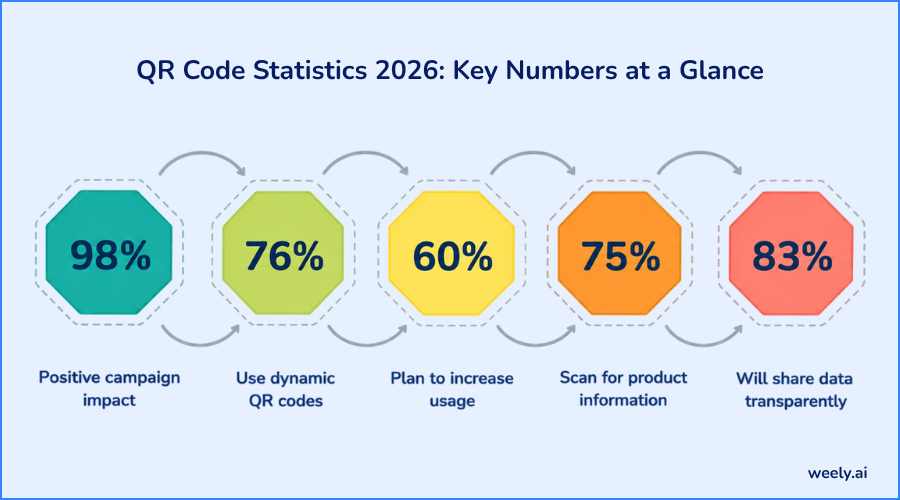
- 98% of marketers report a positive impact from using QR codes in campaigns.
- 76% of marketers now use dynamic QR codes rather than static ones.
- 60% of marketers plan to increase their QR code usage going forward.
- 75% of consumers scan a QR code specifically to get more information about a product or service.
- 83% of consumers are willing to share personal data with a business when the request is transparent and consent-based.
Beyond consumer and marketer sentiment, the hard numbers are just as telling: QR scan volume rose 6.2% year-over-year through H1 2026, retail QR-payment transactions are projected to climb from 454 billion in 2025 to 741 billion in 2030, and the global QR code market is estimated at $15.23 billion in 2026. Together, these QR code statistics 2026 confirm that QR codes are no longer a novelty; they are a default channel for connecting physical and digital experiences.
QR Code Adoption Statistics in 2026
QR code usage statistics 2026 show adoption spanning nearly every kind of business, from single-location restaurants to global retail chains. The numbers below reveal how fast that adoption is spreading and which businesses are driving it.
How many businesses are using QR codes?
QR codes have evolved from an experimental add-on to a standard tool in the marketing and operations toolbox. Restaurants use them for digital menu QR codes, retailers use them for product information and manufacturers use them for packaging and traceability. QR code adoption statistics show this is not just the domain of big businesses; small companies have adopted QR codes just as quickly as they require almost no infrastructure investment, just a printed code and a smartphone camera.
Are QR code scans increasing in 2026?
Yes. Within the industry, recent tracking has shown a 6.2% increase in QR code scans year over year from the previous year. In reading QR code scan statistics, it helps to separate a few related but different metrics: the number of QR codes created, the number of total scans, the number of unique users scanning and how often the same person scans a given code. It means a business can create fewer codes but have more scans per code, which is actually a healthier sign of engagement than raw code volume.
Are businesses planning to use more QR codes?
The momentum is building, not easing. Around 60% of marketers say they plan to increase their QR code usage in upcoming campaigns, according to current QR code adoption trends. This growth is less about novelty and more about the fact that a good Weely AI free QR code generator now plugs directly into analytics, CRM systems and payment platforms, making QR codes measurable in ways they weren’t a few years ago.
How Consumers Are Using QR Codes in 2026
Consumer behavior is a key piece of QR code usage statistics 2026 and why adoption is growing. Here we look at why people scan, how often and what makes someone pull out their phone.
Why do people scan QR codes?
Consumer behavior is the other half of QR code usage statistics 2026. People scan codes to access information, view restaurant menus, find product details, download apps, connect to Wi-Fi, get event tickets and unlock discounts. Some 75% of consumers say the primary reason they do so is to obtain more information about a product or service before they decide to buy it.
How often do consumers scan QR codes?
The scanning frequency varies considerably by industry and region. A diner may scan a restaurant’s menu code every time they visit, while a shopper may scan a product authentication code just once. That’s why QR code consumer statistics should always be interpreted in context; a low scan-per-code average in retail packaging isn’t necessarily a failure, as many packaging codes are built for a single use like warranty registration.
What makes consumers willing to scan?
Consumers respond to convenience, clear directions and an obvious payoff. A code that explicitly promises “Scan for 15% off” is a far cry from an unlabeled code that has no context. Trust is also a big factor; a recognizable brand name next to the code, a secure-looking landing page, and a mobile-friendly destination all boost willingness to scan. Poorly optimized landing pages are one of the biggest reasons for a QR code campaign to underperform despite the code itself getting plenty of scans.
Where Are Businesses Using QR Codes?
QR code usage statistics 2026 show businesses placing codes across nearly every physical, and digital touchpoint. From marketing and packaging to restaurants, retail and events, the sections below cover the biggest use cases.
QR Codes in Marketing and Advertising
QR codes are everywhere now, in virtually every marketing channel. Some 64% of marketers use them in social media campaigns, 60% in digital advertising and 50% still use them in print advertising (posters, fliers, direct mail). Billboards and event signage are also common placements, using a QR code to allow a static physical ad to lead directly to a dynamic, trackable digital experience.
QR Codes on Product Packaging
Packaging is one of the fastest-growing use cases in QR code business statistics, with around 42% of brands placing QR codes for product packaging on their products. Common use cases include sharing product information, instructions for use and a list of ingredients; authentication to combat counterfeiting; supporting warranty registration; running loyalty programs and communicating sustainability information such as sourcing and recyclability.
QR Codes in Restaurants
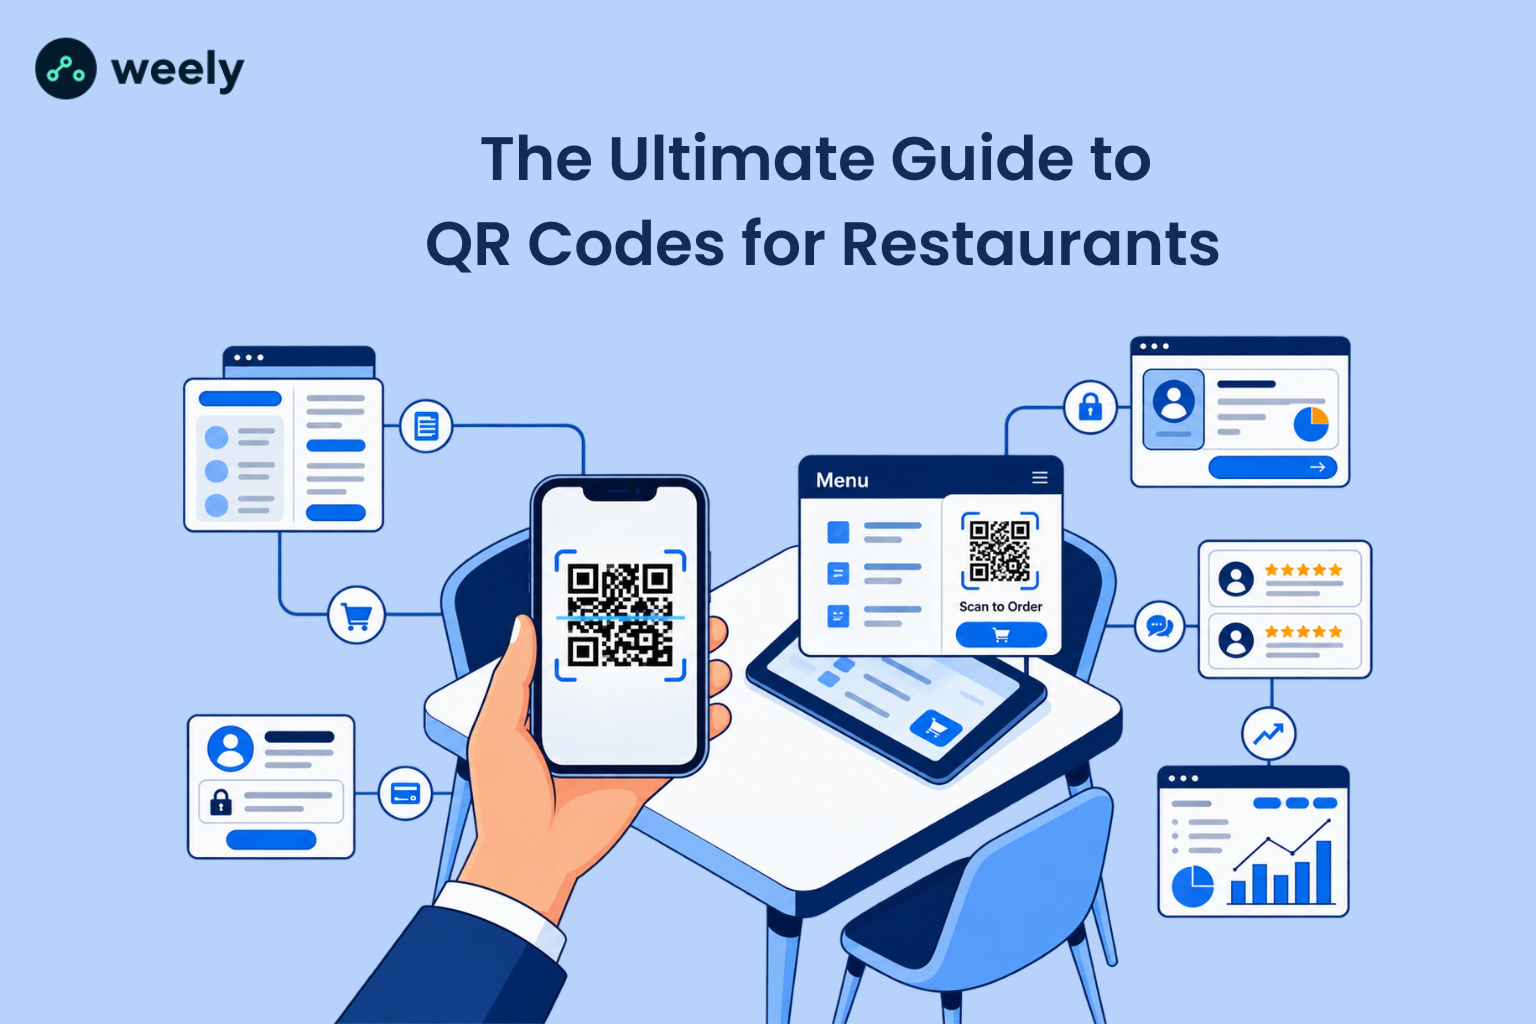
Restaurant businesses use QR codes for digital menus, orders, payments, reservations, review collection, loyalty programmes, and feedback forms. About 48% of consumers say they've scanned a QR code specifically to view a restaurant menu, making QR codes for restaurants one of the most familiar and widely accepted use cases across all demographics.
QR Codes in Retail
In retail, QR codes can be used for product discovery, real-time price checks, in-store promotions, product authentication, digital receipts, loyalty programme sign-ups and even inventory management on the operations side. A shopper scanning a code in-store to compare reviews or check stock elsewhere is now a normal part of how QR codes for retailers support the in-store journey.
QR Codes at Events
Event organizers use QR codes for event tickets, event check-in, event registration, sharing event schedules, venue maps, attendee networking, and event feedback after the event. Event QR codes are also one of the best examples of where dynamic QR codes with real-time tracking add value, because event QR codes are usually used in a short, defined window.
QR Codes in Business Cards and Networking
For instance, a QR code on a business card can replace a whole stack of paper contact details with a single scan that opens a digital profile or portfolio, or a contact-save action; a small but telling example of how QR codes are quietly replacing older analogue habits.
QR Code Payment Statistics
Payment is one of the fastest-growing segments in the QR code usage statistics 2026. Here we look at the global transaction forecast, digital wallets and why small merchants are quickly adopting QR payments.
Global QR Payment Statistics
Payments are one of the largest and fastest-growing categories in QR code usage statistics 2026. Forecasts indicate that retail QR-payment transactions will increase from 454 billion in 2025 to 741 billion in 2030, positioning QR-based payments on par with or ahead of other contactless payment methods in both emerging and mature markets.
Why QR Payments Are Growing
This is driven by a number of factors, including near-universal smartphone ownership, the rapid expansion of digital wallets, low hardware requirements compared to card terminals, growing consumer comfort with contactless transactions and low barriers to entry for small merchants that can accept payments with just a printed code.
QR Codes and Digital Wallets
QR codes are the link between a physical transaction point and a mobile wallet. Instead of swiping a card reader, a customer scans a code that pulls up payment details already stored in their wallet app, finishing the transaction in seconds with no physical card exchange.
QR Payments for Small Businesses
QR payments are especially popular among businesses such as restaurants, street vendors, independent retailers and service providers that cannot afford traditional point-of-sale systems. One of the biggest reasons why QR code adoption has spread so rapidly among small and micro-businesses is that one printed code can accept payments from any smartphone.
Dynamic QR Code Statistics
QR code usage statistics 2026 give just why dynamic QR codes are the industry standard now. In this section, we’ll look at what dynamic codes are, how they differ from static codes, and why 76% of marketers are now using them.
What Percentage of Marketers Use Dynamic QR Codes?
Dynamic QR codes have become the industry default: 76% of marketers now use a dynamic QR code generator rather than static codes. Unlike static code, a dynamic QR code enables the destination URL to be changed after printing and each scan can be tracked and analyzed.
Static vs Dynamic QR Codes
A static QR code has a fixed destination that cannot be changed once printed and generally provides no or very limited scan tracking. A dynamic QR code, in contrast, passes through a short link that is managed by the business; the destination can be changed at any time, every scan is logged with data such as location and device, and the same code can be used for multiple campaigns. For a closer look at how the two compare feature by feature, see this breakdown of static and dynamic QR codes. Static codes still have their place for permanent, unchanging information, but dynamic codes are the obvious choice for anything related to a marketing campaign.
Why Businesses Prefer Dynamic QR Codes
Dynamic QR codes are perfect for businesses, as they offer real analytics, the ability to change the destination without having to reprint assets, A/B testing, the ability to see which physical locations are generating the most scans, and the ability to use one printed code in a long-running campaign that changes over time.
QR Codes and First-Party Data
First-party data is an increasing use case in QR code usage statistics 2026. In this section, we’ll cover what a scan can tell a business and how it can do this with the consent of the consumer.
Can QR Codes Collect Customer Data?
A QR scan is an organic way to collect first-party data. This can be email or SMS sign-up, a short survey, loyalty program registration, product registration, event registration or a lead capture form built with a UTM tracking link, all without the friction of typing a URL manually.
QR Codes and Customer Consent
Here the consumer willingness is high: 83% of consumers say they are willing to share data if a business is transparent and asks for consent in the right way. That means telling users clearly what data is being collected, explaining why it’s needed, offering a real choice rather than a forced opt-in, and never disguising where a QR code actually leads.
QR Codes as an Offline-to-Online Marketing Channel
QR codes are basically a bridge linking the physical world with the digital world. This is what a funnel generally looks like: You have a physical interaction with a poster, package or menu that leads to a scan that opens a landing page that drives engagement that converts into a lead or a paying customer. Each of those steps can now be measured and that’s exactly what’s changed since the first adoption of QR codes into the mainstream.
QR Code Marketing ROI Statistics
QR code usage statistics 2026 show marketer sentiment is overwhelmingly positive, but measuring real revenue is a different story. This section looks at how businesses measure performance and where the largest gap still is.
Do QR Codes Increase Sales?
Marketer sentiment is very positive; 98% report a positive impact from QR code campaigns overall. Sentiment and tight measurement of sales are two different things, and that gap is one of the most important statistics to know about QR code marketing.
How Businesses Measure QR Code Performance
Businesses that derive real value from QR codes are those that track scan volume, unique scans, click-through rate, conversion rate, leads generated, purchases completed, revenue attributed, scan location, device type, and performance by individual campaign. A beneficial place to start setting up this kind of tracking correctly is a QR code analytics guide.
The QR Code ROI Measurement Gap
The QR code scan count is the number that matters most: While 98% of marketers say QR codes have had a positive impact, only a small percentage, often quoted at around 12%, directly measure the sales or revenue that comes from those scans. This measurement gap means most businesses are running on instinct and not data, which is exactly the problem that dynamic QR codes and proper analytics dashboards are built to solve.
QR Code Industry Statistics
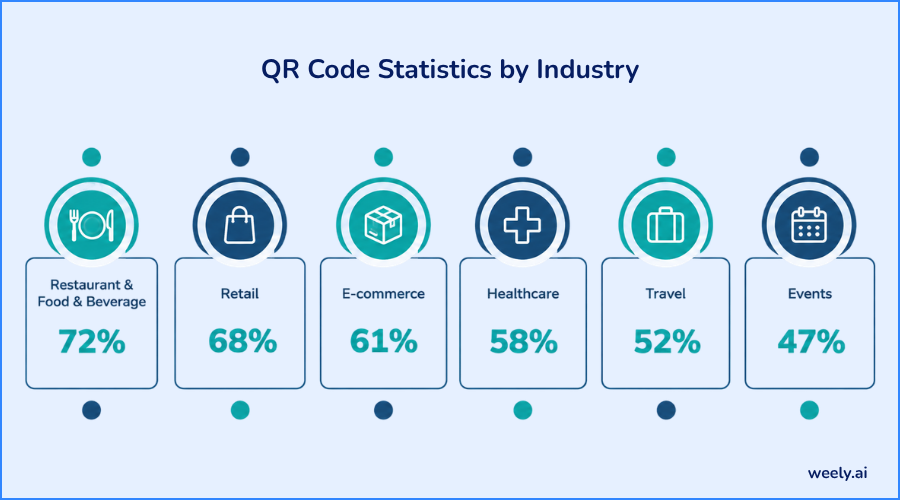
QR code industry statistics show meaningful variation in the ways QR code technology is applied. Restaurants need menus, ordering, and payments. Retail is product information and promotions. Codes on packaging are used in e-commerce to collect reviews and returns. They are used in health care to obtain patient information and schedule appointments.
They are used in travel and hospitality for tickets, check-in, Wi-Fi access and concierge services. Real estate uses them for property listings, education uses them to distribute learning resources, QR codes for event management registration and check-in, and manufacturing and logistics use them for tracking and traceability. And this cross-sector spread is one of the core reasons why QR code business statistics keep rising year after year.
QR Code Usage by Business Size
The implementation of QR codes varies by business size, from a single printed code on a restaurant table to enterprise-wide packaging, and supply-chain systems. This section explains how small businesses differ from large organisations in their use of QR codes.
How Small Businesses Use QR Codes
Small businesses often use QR codes to achieve practical, low-cost wins such as linking to a restaurant menu, directing customers to leave a Google review, sharing contact details via a business card maker, accepting payments, promoting a discount, or running a simple loyalty programme.
How Enterprises Use QR Codes
Larger organizations are deploying QR codes on a massive scale. This encompasses global packaging lines, multi-market retail campaigns, product authentication systems, supply chain tracking, customer experience programmes, and centralized analytics dashboards that aggregate data from thousands of codes simultaneously.
Why QR Codes Are Accessible to Small Businesses
Cost and simplicity are what small businesses are looking for. There’s no expensive hardware to buy and no physical infrastructure to install; just a printed code and a smartphone camera, which makes QR codes one of the most accessible marketing and payment tools available to any size business.
QR Code Market Size and Growth
The QR code market itself is worth monitoring beyond scan and adoption data. Here you can learn about the current market size, its trajectory by 2031 and what’s driving the growth.
Global QR Code Market Size in 2026
The global QR code market is estimated at $15.23 billion in 2026, reflecting how central the technology has become across payments, marketing and packaging.
QR Code Market Forecast to 2031
That figure is projected to more than double to an estimated $33.14 billion by 2031 as the adoption continues to spread into new industries and regions.
Why the QR Code Market Is Growing
Growth is being driven by increased smartphone and mobile wallet adoption, the ongoing shift to digital payments, retail’s broader digital transformation, expanding use in packaging, rising demand for marketing analytics and the retail industry’s transition to richer 2D barcode standards.
QR Codes and 2D Barcodes: The 2027 Retail Shift
Retail checkout systems are braced for a major format change. In this section: 2D barcodes, GS1’s 2027 timeline and what it means for product packaging and traceability.
What Are 2D Barcodes?
QR codes are a type of 2D barcode, a format that can hold much more data than a traditional 1D barcode. They can hold things like links, batch numbers, expiry dates and traceability info all in the same tiny square.
The 2027 Retail Barcode Shift
Global retail standards bodies have set an ambition for point-of-sale systems worldwide to be able to scan 2D barcodes, including QR codes, alongside traditional barcodes by 2027, allowing a single code to handle both checkout and rich product information.
What This Means for Businesses
This opens up the possibility for product packaging to provide much more than just the price: information about sourcing and traceability, enhanced anti-counterfeiting features, increased opportunities for consumer engagement and more transparent information on sustainability, all within the same code that a cashier would scan at checkout.
QR Code Security Statistics and Risks
QR code security is a growing concern as scanning becomes second nature. This section explains what quishing is, how scams operate, and practical ways to ensure codes stay safe.
What Is Quishing?
Quishing is QR code phishing: a scam that uses a phoney or modified QR code to direct victims to a malicious website rather than the destination they are expecting.
How QR Codes Are Used in Scams
Some common tactics include fake payment QR codes placed over real ones, malicious stickers slapped on legitimate posters, fraudulent parking-meter codes, phishing websites disguised as login pages, fake app-download prompts and cryptocurrency scam redirects.
How Businesses Can Make QR Codes Safer
A few practical habits go a long way: use a recognizable, trusted domain for the destination link, make sure the landing page uses HTTPS, physically audit printed QR codes on a regular schedule using a QR code scanner to verify destinations, monitor where dynamic codes are redirecting traffic, keep the visible destination clear rather than hidden, avoid disguising the true landing page in any way, and take a moment to educate customers on what a legitimate scan from your business should look like. For a deeper look at common attack patterns, see this QR code security guide.
QR Code Trends to Watch in 2026 and Beyond
Several patterns stand out among current QR code trends 2026: dynamic QR codes are becoming the default rather than the exception, QR campaigns are becoming increasingly data-driven, QR payments continue expanding across new markets, product packaging is becoming more interactive, QR codes are connecting physical and digital experiences more seamlessly, 2D barcodes are set to reshape how retail checkout works, and QR code security is getting more attention as scam attempts rise alongside adoption.
How Businesses Can Get More Value From QR Codes
Turning these QR code usage statistics 2026 into real results comes down to a handful of practices: give people a genuine reason to scan rather than a code for its own sake, make sure the landing page is mobile-friendly from the first tap, use dynamic QR codes for anything tied to a live campaign, track more than raw scan counts, connect scan data back into a CRM or analytics platform, test different offers and placements against each other, and keep the code itself visually trustworthy so people feel safe scanning it.
Businesses ready to put this into practice can create a Weely AI account to build customizable, trackable QR codes with real-time analytics, UTM support, and expiration controls; the kind of tracking that closes the ROI measurement gap discussed earlier and turns a simple scan into a measurable part of the marketing funnel. A URL shortener built alongside the QR code can also help track traffic from links shared outside of print materials.
Conclusion: QR Codes Are Becoming Business Infrastructure
The most obvious insight from QR code usage statistics 2026 is that QR codes have grown beyond their original meaning to be a simple way of opening a webpage. Today, QR codes link the physical world to the smartphone, the smartphone to a digital experience, and that experience to real customer data and revenue. 98% of marketers are reporting a positive impact, 76% are now using dynamic QR codes, and retail QR payments are on track to grow from 454 billion to 741 billion transactions by 2030.
The next phase of QR code usage statistics 2026 and beyond, will be less about generating more codes, and more about generating better experiences after the scan and finally closing the gap between marketer optimism and actual measured results.